ABSTRACT
State agencies are tasked with capturing and evaluating immense amounts of roadway structures and asset features under tightening budgets and expanding needs. The extent of stakeholders involved at each point in the process is growing and the technologies available to extract and distribute data vary from department to department based on historical applications, I.T. structures, software preferences, field training methodologies, asset integration levels, and more. The following work is a description of successful practices to coordinate all stakeholders and unify asset inventory needs to generate enterprise datasets and distribute actionable information efficiently to all levels of the agency for asset management purposes. The utility of coordinated stakeholder involvement is captured in the estimated reduction of pavement engineers’ in-field inspection times by 50 percent, enhancing the safety of department personnel by minimizing their exposure to heavy traffic and economizing efforts via time-savings using virtual data visualization.
Keywords: Stakeholder Engagement, Asset Inventory, Transportation Asset Management, Asset Data Centralization, Asset Definitions, Asset Extraction Methods, Data Integration
INTRODUCTION
Transportation asset management is a highly complex endeavor affecting many stakeholders across the life cycle of highway and city infrastructure features maintained by federal, state, and local agencies. The use of centralized data to assist agencies tasked with this management is becoming common practice as geographical information systems (GIS) allow for better data integration. The Iowa Department of Transportation has been a great example of fostering a culture of data sharing and bureau collaboration while developing a robust Roadway Asset Management System (RAMS) to house all asset inventory information which supports the many bureaus of the department. This work details some aspects of the successful practices found in transportation asset management from the perspectives of the DOT, an industry leader, and an educational institute for engaging and collaborating with the stakeholders involved in asset management. Successful solutions realized in this paper include:
A Culture of Sharing; The Groundwork for Success
By the accounts of numerous long-time employees at the Iowa Department of Transportation, the agency is found to thrive with a culture of collaboration and data sharing from bureau to bureau. Communication is highly valued in the DOT and the mentality of always asking “who else could use this data” (1) has been engrained in the culture of the organization. This work would be incomplete without recognizing that replication of an entire office culture is far more extensive than a single paper can incorporate, and yet, it is the attitude towards collaboration that is an important aspect for any successful coordination with stakeholder involvement. The groundwork for developing and fostering an atmosphere of collaboration among asset management projects was targeted specifically with the start of Moving Ahead for Progress in the 21st Century Act (MAP-21) (2) in 2012. While the Iowa DOT had introduced its employees within its divisions to the idea of asset management and leadership championing efforts long before the requirements MAP-21 placed on the DOT, it served as a catalyst for some initiatives furthering the pursuit of agency-wide collaboration. Giving the DOT personnel the tools and training needed to be “champions” of their bureaus really enabled their groups to pursue and complete important projects. This was vital to the success of asset management, as all successful projects are seen to fruition by a “champion” of the cause and effort. If there is not a champion to generate excitement, confidence, and need for a project, it might be discussed and never gain traction. Additionally, the Iowa DOT has long understood the importance of communicating early with all stakeholders about asset management and keeping the various departments aware of the possibilities. In 2014 at an asset management peer exchange in preparation for MAP-21,the Transportation Division Director at the Iowa DOT shared that, “champions are important, but it is crucial that asset management is introduced using a number of methods to ensure the concept is assimilated through the agency.” (3)
AN EXAMPLE: STATEWIDE ASSET EXTRACTION
To best detail the communication and coordination of a large-scale project, this section will follow an example of the best practices for developing a statewide asset inventory project.
The Iowa Department of Transportation is structured similarly to other state agencies in that each focus of traffic control and infrastructure development and maintenance are clustered together with specialists of each field division, commonly labeled a “bureau” within the DOT. The separate bureaus concentrate on their unique challenges, each with their own inventory processes and planning methodologies, but several bureaus are supported by the data from a unifying section, the Analytics Bureau. Many divisions’ data flows through the Analytics Bureau creating a central line of data for which the bureau is tasked with managing. Leveraging their familiarity with the numerous other bureaus’ needs, the personnel within the Analytics Bureau had an in-depth understanding of which groups could benefit from a statewide asset extraction project to update and enhance the asset inventory and condition assessment measures. The bureaus targeted for participation included: Systems Planning, Bridges and Structures, Rail, Traffic and Safety, Construction and Maintenance, Motor Carrier, Location and Environment, and Traffic Operations.
Prioritizing Asset Needs with Extraction Methodology
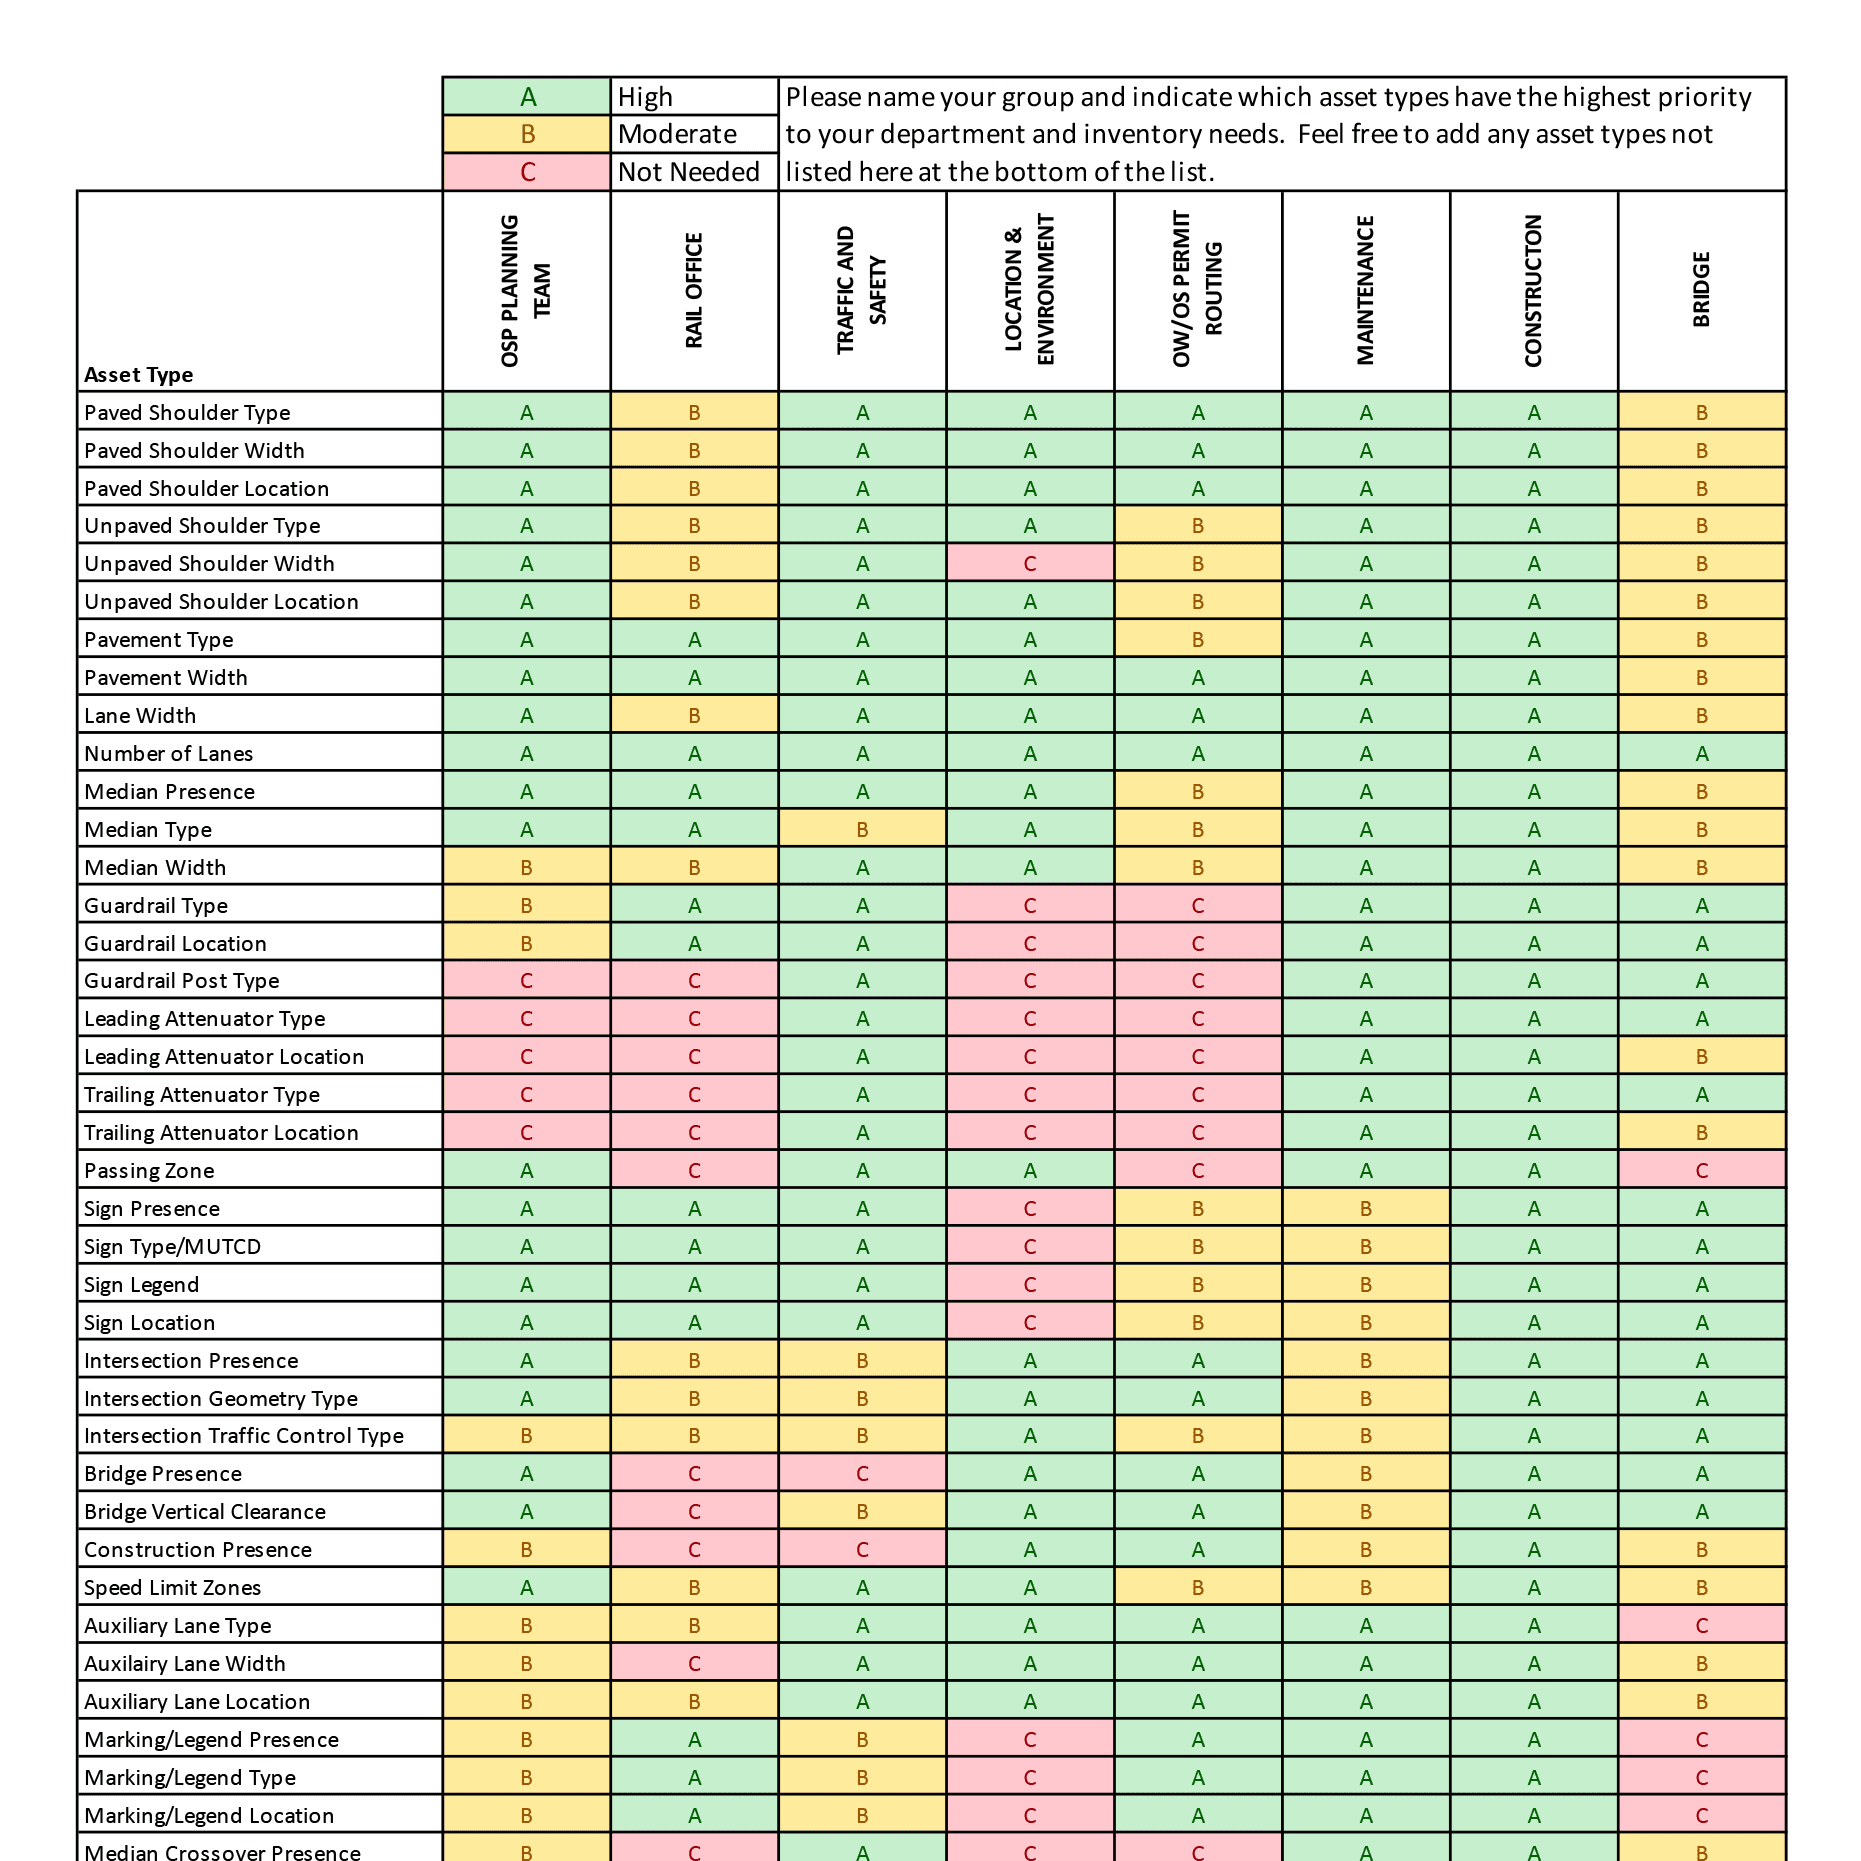
At the onset of the statewide asset extraction project, the initial task was to determine all possible asset items that were needed from the nine different participating bureaus, including the Analytics Bureau. Each group was invited to an individual in-person meeting by the Analytics Bureau and presented with a guide of roadway asset items that could be inventoried from annually collected imagery data. After the departments were introduced to the material, they were gauged on level of interest in the project and then asked to provide all possible asset items their group would utilize from such an extraction effort. After the master list of asset items was compiled, each bureau was asked to rank the importance of each asset type in an email survey with a scale of A, B, or C. A score of “A” indicated a high need, “B” represented a moderate need, and “C” indicated that item was not needed in that bureau. The prioritization survey enabled the Analytics Bureau to develop a master table of asset types (TABLE 1). This needs elicitation became the base-line for examining cost estimates with budgetary limitations, which led to the next steps in the process, determining the asset definitions and attribute requirements.
Developing Asset Definitions
Once the asset inventory prioritization was established, the process moved on to extraction methodologies based on individual asset type definitions. Expertise and familiarity of a wide range of asset metrics and attribution types was important for this conversation. The Analytics Bureau, in conjunction with Pathway Services Inc., held in-person meetings with each group to discuss in detail the needed characteristics for each asset definition. The best support a centralized data system can provide starts with the lowest level of information, as granular as the inventory can allow. To illustrate this concept, we can dissect a common Highway Performance Monitoring System (HPMS) requirement as it connects to a Model Inventory of Roadway Elements (MIRE) description and also typical design, safety, and maintenance aspects of guardrail data. Item 35 of the HPMS field guide covers “Median Type” giving 7 code options for median characteristics, including: none, unprotected, curbed, positive barrier – unspecified, positive barrier – flexible, positive barrier – semi-rigid, and positive barrier – rigid (4). Similarly, MIRE section 57 also refers to “Median Barrier Presence/Type” listing the same 7 recommended attributes, however, previous in the guide under section 55 is “Median Type” which has a set of 9 attributes: undivided, flush paved median, raised median, depressed median, two-way left-turn lane, railroad or rapid transit, divided without retaining wall, divided with retaining wall, and other divided (5). Finally, among typical bridge, maintenance, and safety groups, the descriptions and definitions of guardrails and concrete barriers are far more extensive and require a detailed level of locations, types, end treatments, attenuators, distance from the pavement edges, post material types, and much more. Here, for example and illustrated in Figure 1, it was determined that the guardrail barriers were a high demand item as well as the HPMS median type report. If each of these three entities were left to their own inventory, the data would include a layer specific to HPMS segments, multiple layers specific to MIRE details, and yet further layers of the individual guardrails and concrete barriers, tripling the extraction efforts in time, data storage, and cost. However, by starting at the lowest level of detail, the individual guardrails, and working backwards, utilizing the design of the centralized data through the Analytics Bureau and the collaboration of stakeholders, the project’s asset inventory definitions were focused to serve all groups simultaneously, in a single asset inventory effort.
Figure 1 Centralized Data Illustration - Lowest Level Assets
The medians would be extracted with MIRE-like material types of asphalt, concrete, curbed paved, curbed unpaved, grass, gravel and other while the guardrails would be extracted separately with types of cable, w – beam 3 rail, w – beam 4 rail, box beam, concrete, handrail, wood, steel beam, and other. These two layers, plus that of a detailed auxiliary lanes layer, encompassed all the characteristics required to determine the HPMS median types.
During these meetings, while analyzing the most granular aspects of each asset item as seen by each group, another purpose was served. There was asset data a certain group had that another group needed that was unknown until that moment when it was brought forth for this inventory project. Despite the agency’s best efforts in organization and communication, there remained some overlap in the DOT’s efforts of naturally siloed work. Discovering these overlaps created the opportunity to disseminate existing data to those in need and gain a cost-savings in not requiring those asset items as a part of the statewide asset extraction project.
Once the lowest level of detail was established for each individual asset item, the next phase in the process was to collaborate with each division on the types of attributes and characteristics each asset item should have and to unify the terminology and language used for the definitions of the project. For instance, the asset item of auxiliary lanes developed for this project has a type attribute with 9 selection options. Among these options are the types “Offset Right Turn Lane” and “Offset Left Turn Lane” (6) representing turn lanes with a painted chevron spacing buffer from the through lane. Originally, these auxiliary lane types were known to the various groups, but each had different terms or titles for the lane names. These titles were agreed upon among the groups and the asset definition was supported with picture examples (as depicted in Figure 2) of this attribute type to clarify for any future users.
Figure 2 Auxiliary Lane Type Extraction Guide Example
Attribute terminology clarifications was followed quickly in the scope development by extraction methodologies. Many roadway asset items require measurements as an attribute of their inventory information. Shoulders, for example, are often accompanied with a width measurement value, but how and where to take the measurement required much collaboration from the various groups that regularly interacted with the Shoulder data. A Shoulder width can be started on the inside of the painted stripe, the outside of the painted stripe, or in the middle of the painted stripe, a potential difference of 6-8 inches depending on the striping width. Driveway point locations can be taken at the front of the driveway, the middle, or the furthest edge point of the driveway. Parking zones can begin with a marked sign or based on the formation of the paved roadway and usage. How these extraction methods are interpreted is less important to who they are developed with, how they are documented, and where they can be accessed by the end users. The best practices recognized in this project allowed the field experts to define how certain measures should be made to match historical methods, engaged receiving departments in the approval of guides with the definitions, and made that document central to training in the data distribution.
Managing Asset Extraction QA/QC
To build trust in the data extracted for this asset inventory project, both Pathway Services Inc. and the Analytics Bureau had to develop QA/QC procedures to validate and verify the accuracy of the information reported. Internally for Pathway Services Inc., the quality control process starts with automated checks detecting errors such as duplicated data, overlapping asset inventory items, missing asset item features and completeness of spatial asset coverage. This initial QC process is performed on each ~100 miles of data as they are completed for asset extraction to ensure no systematic errors are propagated throughout the entirety of an asset extraction project. The next quality control step for this asset extraction project is to create shapefiles of each asset layer from the error-free data confirmed in step one. These shapefiles are created in groups of roughly 1,000 miles for spatial analysis and are viewed in a GIS environment by trained quality control team members who visually scan for any erroneous or atypical data points appearing within the line-work. Throughout the project production, there are regular image verification checks on randomly selected sample sections as a continuous effort in data quality validation.
When the asset extraction is completed for the entire asset project, the last step is for all asset field attributes and domain values to be reviewed in the text file/CSV format and to verify there are no empty/null values in the tables. Each asset item and unique associated attribute values are also analyzed through a specific set of rules according to the project definitions. Asset types have their own acceptable range of values for their asset attributes (i.e., width, length, type) and any values outside of this range will be examined in the roadway imagery and spatial environment to determine their validity. For an example of an “acceptable” value range we can look to Auxiliary Lanes and their asset’s attributes of width and length. We would consider an Auxiliary Lane Width between 8-12ft to be an acceptable value range and any value outside of this range would be flagged for review in the roadway imagery to confirm its accuracy. Likewise, we would consider an acceptable value range for an Auxiliary Lane Length to be between 15ft and 2640ft. Any value outside of this range would also be reviewed in the roadway imagery to verify its measurement. Once all asset items have gone through every step of this process, they are considered finalized data and ready for delivery to the Iowa DOT. If any corrections are required to an asset after delivery, it must go through the entire QC process again.
On the agency’s side of quality assurance, the Analytics Bureau designed an asset review process seen in Figure 3 below. Asset data deliveries received detailed quality assurance measures and were returned for correction at any point along the way.
Figure 3 IDOT Asset Review Workflow
The Iowa DOT completed a similar process that checked for anomalies in the attribution data, obvious errors in the spatial data, and finally conducted a visual analysis of randomly selected sections that were reported to contain the specified assets. A pass/fail threshold of one error per segment determined if a segment was considered accurately recorded by Pathway Services according to the imagery that was used to compile the data. A tolerance of 10% (or 90%) accuracy was determined to be the cutoff for acceptability of an asset data set.
STAKEHOLDER ENGAGEMENT AT THE IOWA DOT
With the passage of the MAP-21 and FAST Act, state DOTs have embraced the stakeholder engagement approach to put together their TAMP documents. A 2018 survey of how state DOTs are integrating risk in their TAMPs found that more than 90% of agencies that responded have all created a TAM task force that is made up of asset managers, representatives from various divisions/departments- basically a collection of the stakeholders in order to put together their TAMP documents (7). This practice has extended to various components of asset management of which Asset Inventory is prime. The Iowa DOT, in order to manage its pavement condition data collection efforts, setup a Data Management Working Group, that is made up of a group of engineers and subject matter experts from the Districts and central office, as well as external partners such as FHWA, Iowa State University, and the data collection vendor charged with continual improvement of Iowa DOT’s data collection efforts. This team has been actively working on developing and improving the quality of the data driving its pavement management system. (8)
Local Entity Involvement
A uniqueness the Iowa DOT has in comparison to other state agencies is that it collects all local roads in addition to the statewide data. This creates an opportunity for the local agencies to benefit from having frequent inventory updates and institutional support for their planning, preservation, and maintenance activities.
As part of its involvement in the IADOT Data Management Group, Iowa State University through the Institute for Transportation manages the Iowa Pavement Management Program, IPMP, which is funded by the IA DOT to manage the local agency's data collection and distribution. IPMP is an excellent example of how stakeholder coordination provides value to its users. IPMP provides a system for local agencies to communicate among themselves and with the Iowa Department of Transportation (DOT), as well as be part of the process for providing valuable feedback in streamlining the pavement data collection process to ensure that it provides attributes that the local agencies can use for synthesizing maintenance and investment strategies in addition to maintaining databases of information that can be utilized to provide statewide local agency information. In addition, IPMP provides a mechanism to become conscious of and respond to emerging data collection issues in a more efficient and effective manner.
IPMP provides stakeholders input using a quarterly users’ forum and subcommittee working group for exploring specific tasks. This forum usually has a representative from the DOT to provide DOT updates that can potentially impact local agencies. This provides an opportunity for the creation of relationships between the local agencies representatives and the DOT to share and learn from each other, and discuss what has worked and what has not worked, and why it did not work.
Uses/Benefits of the DATA
This section discusses the benefits of the data to the local agencies. These benefits are maximized depending on the size of the local agency involved. Regardless, IPMP works with each local agency to provide data support and training on how to integrate the data into their pavement management program. IPMP also works with consultants that work directly with the local agency, if applicable.
Pavement Inventory and Condition
Being able to accurately represent the pavement management sections is a huge advantage to the local agencies. It takes a lot of guess work out of pavement maintenance and creates a systematic framework for long term pavement management. On the interim, it provides a measurable technique of presenting the pavement health of the local agencies to elected officials and other stakeholders. In addition, the local agencies get to keep the raw data and have access to the video log providing a bank of data over time that local agencies can use to not only represent their network but to model it to be able to forecast needs.
Short- and Long-Term Planning
Having this data allows local agencies to prioritize their maintenance dollars in order to maintain overall network efficiency that delivers a level of service that maintains a safer, reliable, driving surface. Some local agencies use the data to manage their annual as well as 5-year construction program.
Communication to Upper Level and Field Staff
These agencies have found in the IPMP data an effective tool for communicating the roadway infrastructure needs as well as engaging stakeholders on optimum strategies for managing their investments. In addition, IPMP has provided web access to the data that can be accessible via mobile devices to help field staff investigate bad spots along a pavement management section.
Asset Inventory for Local Agencies
As part of the data collection efforts, the local agencies will have an inventory of all assets in the ROW. This is something that some local agencies have paid for in the past for its extraction, now they will have that inventory free of charge to be able to have a holistic asset management program if desired.
Collaboration
The Analytics Bureau of the DOT collaborates directly with district level personnel on construction and maintenance projects including new construction, surface condition, and repairs. District personnel have access to similar information that local agencies have access to with the added benefit of greater detail of the information contained within RAMS as they are able to provide greater levels of detail through construction plans and as-built specifications. Additionally, the Analytics Bureau provides information on historical road construction and projects on State owned routes where information has been provided. This information can be viewed in conjunction with the roadway imagery and pavement imagery/information through the use of various applications also supported by the Analytics Bureau.
The addition of the asset information provides the districts with more granular information on a broad range of the appurtenances for the facilities that they are charged with maintaining. For example, the shoulder composition and width of multi-surfaced shoulders provides the districts with information that may have only anecdotally been available in the past, or contained within paper records that have not been digitized.
RESULTS
Statewide Asset Project Summary
Using roadway images which covered 45,900 miles worth of Iowa’s paved roadway network over the course of a 2-year cycle, and through the collaborative efforts of the 9 bureaus, led by the Analytics Bureau and Pathway Services Inc., the DOT now owns millions of asset items and enhanced data definitions the entire agency can leverage for planning and analysis. The sophisticated manuals of detailed asset definitions and extraction methodologies will support the Iowa DOT for future processes and feed new and different projects as more versatile uses are found. Illustrated in the volume of inventory items seen in Table 2, this network-level project was an immense undertaking and will provide much needed updates for many bureaus.
Similar to the volume of data shown in the quantity of assets in Table 2, below in Figure 4 is a powerful image of multiple spatial layers created from the statewide asset project. For example, each yellow dot represents a driveway location from the “Driveways” layer. Many projects for strategic planning committees or maintenance groups can easily review density and volume of driveways by zooming in on a map with this layer loaded and generate reports on the requirements a particular project might have with regards to the driveway structures present on that road section. Other layers present in the figure below are signs, pavement types, and guardrails.
Figure 4 Sample Map of Multiple Iowa Statewide Asset Layers
Distribution to End Users
As the asset data is being finalized and the asset management system is nearly live, the Analytics Bureau hosted individual meetings with each group to discuss the outcomes and start training on the access methods to the data layers.
Distribution to agency users will utilize the architecture of the current GIS databases in the agency. This includes augmentation of existing tables through the inclusion of the data gathered from the imagery as well as creation of new tables for some assets that were previously not inventoried. As several divisions with the department are engaged in activities related to roadway asset components, the division of information offers the greatest opportunity to both improve upon what data is already available as well as ensure that the maintenance of the data is undertaken by those whom rely upon it.
Within the agency, it has been valuable to market the Analytics Bureau’s existence to the other divisions. With the siloed nature of duties assigned to the various divisions in the DOT, it is natural for data managers and maintenance personnel to lose track of what other divisions and bureaus are doing. As the Analytics Bureau is charged with outreach to the Department’s field personnel as well as local agencies to maintain the central road inventory data, it is a natural coordinating point for data that is used interdepartmentally. In turn, other areas have looked to the Analytics Bureau as a resource for general and technical issues surrounding roadway data. As this arrangement fits neatly with the business model of the Analytics Bureau, there is a benefit to the Department in terms of benefits of time savings and information availability that are orders of magnitude above the additional work necessary to maintain and distribute the information by the bureau.
For the local roads that are collected, the data is distributed to the local agencies via a GIS-enabled web portal that is managed by the IPMP. Each local agency can visualize and download their data using the web applications on the portal.
Time Savings
Pavement engineers travel their roads, districts, and areas year-round to support maintenance and design decisions with data and information about existing conditions and infrastructure presence. In an interview on the subject, IDOT employee of 23 years and resident construction engineer said some structures that required inspection were easily a two-hour, one-way trip for anyone in his office. That kind of drive-time put an engineer on the road for four hours for a very routine inspection. Once he was made aware of the existence of annual images and trained in the accessibility of the data layers, he estimated his onsite field inspections were cut in half (9). Additionally, during an in-field inspection, it can be complicated to document all notes and collect all required information safely from the security of his office computer and could review the images while taking notes at his own pace and layering on other traffic, cracking, and historical condition data to make an informed decision.
Next Steps
The data gathered by Pathway Services will be integrated into the Iowa Department of Transportation’s Roadway Asset Management System (RAMS) database, with some assets used to augment other databases within the department. Even prior to the integration of this data, the Planning Bureau is using the information to create future transportation plans and identify areas slated for improvement. This data will also be used to create a more complete picture of the surface road system for the purposes of MIRE and HPMS reporting. Long term maintenance and updates of the data will fall on the Iowa DOT utilizing tools provided by Pathway Services as well as through normal data maintenance procedures conducted by IDOT personnel.
CONCLUSION
Thanks to the champions of asset management within the Iowa Department of Transportation who addressed the needs and envisioned such a large-scale solution, a single project was able to serve more than 9 agency bureaus and inspired future uses and collaborative efforts. Isolating the lowest level of asset inventory needs and defining the extraction terminology and methodology by engaging all stakeholders through in-person meetings and email surveys were some of the best practices realized during a statewide asset inventory project. The design and development of a centralized data integration system also made it possible for many bureaus to easily access and manipulate the newly enhanced data for planning and analysis purposes. Garnered from the real-world experience of applying the integration of asset data, valuable time savings were discovered via mitigation of DOT engineer in-field inspection times through use of the collected imagery. Lastly, supporting the local agencies through the Iowa Pavement Management Plan managed by the Iowa State University extends further the versatility and use of unified asset data.
Perhaps a most valuable take away discovered, during an interview with the RAMS Administrator at the DOT, was that if another agency attempted to replicate the functions of the Iowa Analytics Bureau or the data integration methods of RAMS, there is a key aspect that must be present. That key is the control and authority the Analytics Bureau maintains over database administration and other schema changes to be able to freely change what needs to be changed, when it needs to be changed. (10) This was made possible through a number of elements. Firstly, the work to centralize asset management data has been ongoing in Iowa for more than 15 years, which allowed ample time to build trust among the personnel spearheading the project from bottom-up within the agency. Next, the given authority to make such valuable changes had been endorsed by enterprise direction, a champion of the efforts contributing from top down. From a culture of data-sharing to proper authorization in the structure of the data integration, combined with frequent and proficient collaboration among the stakeholders and bottom-up level of detail for asset inventory, this effort has been successful in supporting the Iowa DOT’s transportation asset management.
ACKNOWLEDGMENTS
The authors would like to thank Jodi Clement, Michael Clement, Brian Smith, Milly Ortiz-Pagan, and Karen Carroll for their contributions as subject experts.
AUTHOR CONTRIBUTIONS
The authors confirm contribution to the paper as follows: All work, concepts, diagrams, figures, and tables are our own.
AUTHORS
Joe Anthony
Data Analyst
Pathway Services Inc.
Broken Arrow, OK, 74012
Email: janthony@pathwayservices.com
BJ Covington
Information Technology Specialist
Iowa Department of Transportation
Research and Analytics Bureau
Ames, IA, 50010
Email: bj.covington@iowadot.us
Inya Nlenanya
Program Manager
Iowa Pavement Management Program
Institute for Transportation, Ames, IA, 50010
Email: inya@iastate.edu
Lauren Tran
Project Manager
Pathway Services Inc.
Broken Arrow, OK, 74012
Email: ltran@pathwayservices.com
PRESENTATION DOWNLOAD LINK: PRESENTATION - TRB 2022 A Success Sotry of Stakeholder Engagement and Data Unification for Transportation Asset Management
PathRunner Subsystem Upgrades
NEW 3D System: 3D-PAS
NEW HD LiDAR System
NEW 3-Zone Texture Signature System
PathView II
Login to your account to download your latest version of PathView II from the software folder under “Resources”.
PathView
Version 6.2.10 (Released November 23, 2022)
PathWeb
Version 2.28.0 (Released July 25, 2022)
PathPoints
Version 2.67.7 (Released November 21, 2022)