Pavement surface texture is an umbrella descriptor of pavement surface characteristics that can be used to measure skid resistance performance including surface type, materials used in pavement design, pavement condition due to wearing and polishing, and the various gradations of macro-, micro-, and mega-texture. New 3D laser sensors can collect more of the surface texture, defined by the change in surface height, at a higher resolution and higher capture frequency at highway speeds than ever before. Currently, two primary data sets and collection methods are used to identify areas within a network where pavement surface texture conditions create friction-related safety concerns. The first method uses an antiquated standard, relying on outdated technologies and formulas to define macrotexture via Mean Depth Profile (MPD). MPD has proven to be a poor indicator of surface texture condition and must be supplemented with other pavement data for an accurate indication of surface texture condition. Locked wheel skid testing is another commonly used texture data collection method and is often the sole source of an agency’s skid resistance numbers. Skid Number is a notoriously time-consuming, expensive, and potentially dangerous collection method providing sample datasets, and cannot be collected through curvature, often the most important locations requiring skid resistance information. In search of a better method for measuring and interpreting network-level surface texture, this study used state DOT-provided core samples for more than 40 different pavement types and conditions and resulted in the creation of a digital texture signature for known mix designs used in standard road design. The digital texture signature is a statistical analysis of raw texture data captured by a high-resolution line laser system capable of interpreting changes in pavement surface characteristics where an analysis of pavement texture using MPD values is unable to identify texture variation.
State and city agencies responsible for pavement maintenance are challenged with analyzing and assessing a multitude of elements to preserve and improve infrastructure nationwide. The pavement’s surface texture is a principal aspect of each pavement engineer’s condition evaluation, which considers tire-to-pavement friction and skid resistance measurements. These two key elements together are a valuable indicator for safety-related conditions of a roadway and can provide vital information to support decisions for the right treatment at the right time for a maintenance division. Very smooth surface texture can present low skid-resistance values representative of potentially hazardous skid conditions. Additionally, a film of water merely 5mm thick will decrease a pavement’s skid resistance by 20-30% compared to a dry pavement surface. It has long been of interest to the industry to correlate pavement surface texture collected digitally with laser technology with skid-resistance values. The current data collection methods for skid resistance evaluation are complicated and typically only collected on sample sections, not continuously. The correlations of digitally collected texture data to skid-resistance numbers have historically been limited and poorly connected. This study attempts to solve a need in the pavement maintenance industry to improve the data collection method of pavement surface texture and goes further to revolutionize the interpretation of digital surface texture measurements, producing high levels of correlation with skid resistance data.
Often within the pavement management realms, the terms texture and friction are incorrectly used interchangeably because the connection between pavement surface texture elements and the variables affecting friction have inherent dependencies i.e. load being a component of friction and skewness of texture which interactively affects Skid Number. The pavement’s surface texture has a direct impact on the tire-to-pavement friction created by the load and speed of the vehicle in motion. The pavement’s texture is not, however, the only characteristic to impact the friction a tire will encounter while driving over the roadway. In addition to vehicle load and speed, skid resistance is compiled of texture characteristics, environmental conditions and weather, the effects of the condition of the aggregate as they reflect the age and wear, roadway geometry, pavement and tire temperature, tire composition, and more.
Tire-to-pavement friction testing is an important safety element to measure for all pavement managers. Collected using various skid resistance testing equipment, since 1972, the Highway Research Board defines skid resistance as “…the force developed when that tire is prevented from rotating slides along the pavement surface [LT2]”. Skid resistance is typically quantified into a value such as Skid Number using a computed Friction Factor, where:
The Friction Factor and load data are both captured at the moment where skid conditions are created. Skid Number then becomes a calculated value representing those skid conditions, as all environmental, geometric, and force-related variables are incorporated into its computation, and Skid Number becomes the representative data used for correlation with laser-based texture profiling systems.
The pavement management industry has classified texture data, per the International Standards Organization standard for the Characterization of Pavement Texture (International Standards Committee, 2009), as:
Most industry experts rely on the Mean Profile Depth, or MPD, to quantify the average macrotexture depth. The formula to calculate MPD (seen in Figure 2) is as follows:
MPD = (MSD 1:10) / 10
This profile analysis of the pavement’s surface is an effort to understand texture as it relates to the computation of force and load values generated in the skid number analysis.
Both of the methods for collecting MPD and Skid Number are familiar to pavement managers, so it is generally understood that both have limitations and challenges when applied to network-level data collection projects.
Historically, the best way to measure pavement texture performance has NOT been by collecting pavement texture data using lasers. In some cases, the texture data has been utilized as a flag for areas that reported low MPD values, indicating to the agency to investigate further. But even in those cases, conditions exist where low MPD values are not very useful. As indicated in the standard (ASTM International, 2016), “other physical tests” are necessary to understand particulate shape and orientation to get a clear picture of skid resistance. The benefit of locked wheel skid testing is the ability to remove the need for texture interpretation in the creation of Skid Number. Locked wheel skid testing is a real-world replication of skid conditions, measuring the force with all characteristics involved. The complications remain:
To summarize, locked wheel skid testing is valuable data for pavement managers, but the process is impractical, expensive, and cannot provide full network-level data collection.
As technology has improved, the industry has begun to realize the capabilities of collecting pavement surface texture data with the use of laser sensors. In 2001, ASTM E1845 was published that defined both the method for collecting macrotexture data using line lasers and a calculation for Mean Profile Depth (MPD) (ASTM International, 2016). This digital data collection, using both point and line lasers on dry pavement surfaces, solved some of the problems faced with locked wheel skid testing. The laser sensor hardware was fabricated onto collection vehicles and driven on network roadways at highway speeds, removing the need for lane closures or slow velocity safety hazards. Nearly always, these data collection vehicles are equipped with GPS antennas for spatial reference, which has improved the accuracy of data tracking over time for annual comparisons. The standard for calculating MPD stipulates the laser sensors must meet the following requirements:
The current practice for measuring and calculating Mean Profile Depth are outlined below:
While the MPD has been a useful metric and is more easily available than locked-wheel skid testing, there are still existing problems that pavement managers face with its real-world application.
In summary, this method does not provide a complete assessment of the pavement surface texture characteristics. By using only 100 points in 100 mm for ten 10m sections of pavement, the algorithm is analyzing only a small area meant to represent the pavement texture for the entire 1,200 square meter portion of the roadway sampled. This dilution of available information has led to problems interpreting the results when applied to porous or grooved surfaces, causing poor correlation to skid resistance numbers. The standard specifically says, “Aggregate particle shape, size, and distribution are surface texture features not addressed in this procedure. The method is not meant to provide a complete picture of surface texture characteristics. It is known that there are problems in interpreting the result if the method is applied to porous surfaces or to grooved surfaces.” (ASTM International, 2016)
Ultimately, digital texture data collection using lasers is the better way to gather information because it can be collected continuously, it’s safer, and it’s comparatively less expensive. But more and higher resolution data is needed in addition to a new representative value to improve on the weaknesses of the MPD calculation.
As this research topic suggests, the goal is to implement a higher-resolution method for network-level texture data collection for skid resistance analysis. To that effort, new technology and another method of interpreting texture data has been applied for testing. Improved laser technology can now collect texture data at five times the resolution of the antiquated line lasers sufficient for MPD reduction. This results in collecting 500 points within the same 100mm line (0.2mm resolution). The surface texture height (x resolution) changes are measured 5 times as often, providing a much clearer picture of the texture profile.
Additionally, this sensor is capable of sampling at 3 kHz. Instead of collecting one 100mm sample every 10m, the new sensor collects a texture profile every 9mm (0.009m), while traveling at 60mph.
By comparison, instead of 100 data points at 1mm resolution in 10 meters, this new sensor is collecting over ½ a million data points at 0.2mm resolution; 5000 times the amount of data measured at 5 times the resolution.
Further, Mean Profile Depth has historically been collected in the right wheel path only. The new hardware configuration, called the Texture Signature System, uses two additional laser sensors in the left wheel path and center lane locations. Texture Signature data is collected in both wheel paths and in the center of the lane simultaneously, providing a potential “control” value for the non-wheel path portion of the lane. Individual zone-to-zone comparisons can be analyzed to identify a change in pavement type.
This Texture Signature System provides access to a much larger dataset, but if applying the MPD formula and evaluation of data, results are limited to a larger sampling frequency, the selection of peak data points, and the use of averages providing virtually no improvement in MPD’s correlation to Skid Number. What we know is that the minute changes in the texture profile height from data point to data point matter. Each minute elevation change is an explanation of the potential movement of water and the tire’s interaction with the pavement surface itself. In order to consider the data points available using the new high-resolution laser sensors, research required the implementation of a new mathematical expression of texture using all available profile data.
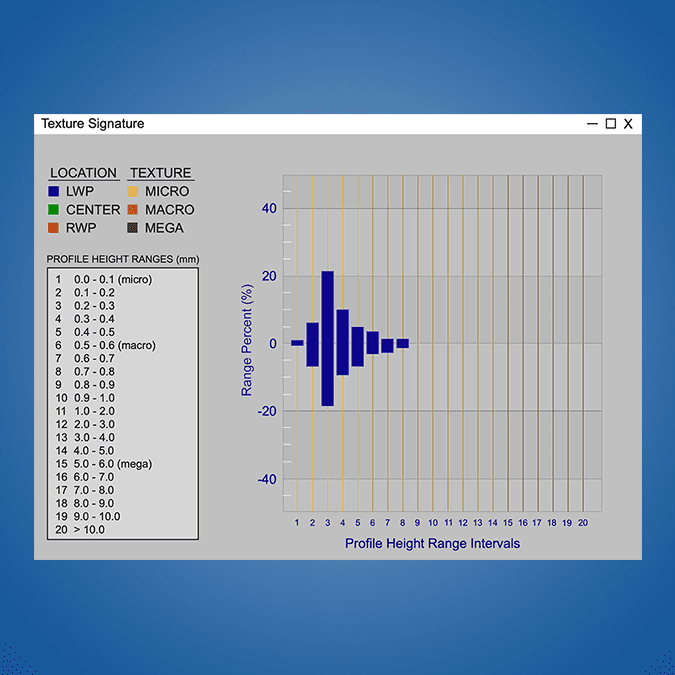
The Texture Signature is a histogram. It is comprised of 20 bins, each representing a change in the texture profile height. The first 10 bins are separated into 0.1mm texture height change categories. As seen in Figure 11, the first bin represents a change in height between 0.0mm and 0.1mm between any given two points of the laser measurement profile. The second bin represents a change in height between 0.1 mm and 0.2mm. The next is between 0.2mm and 0.3mm, and so on until 1mm height changes are reached. After the tenth bin, the intervals skip by 1 mm intervals. So, the 11th bin is a change in texture height between 1mm and 2mm. The next is between 2mm and 3mm. Then between 3mm and 4mm and so on until the last bin, which represents changes in height at greater than 10mm between any given two points.
All the data is sorted into bins, and a Texture Signature histogram displays the percentage of data points in a given collection area that a sorted into each particular bin.
In order to establish a conceptual understanding of what the Texture Signature readings are indicating in the histogram, the researchers first started with manufactured objects for scanning. Controlled objects with observable surface texture characteristics and measured height changes provided the study with a baseline for evaluating sorted data values.
The first example of a scanned profile can be seen in Figure 12 Flat surface object with a texture profile scan and is the scan of a flat tabletop surface. By using a very smooth surface first, the profile baseline representing almost no texture was established. The next step involved generating the Texture Signature histogram to analyze how a smooth texture would be binned. As seen in the next image, Figure 13 Texture Signature histogram of a flat surface, the changes in texture height between points occurred almost entirely in the first bin (0-0.1mm height change) and a small percentage in the second bin (0.1-0.2mm height change). Notably, it is encouraging to see that the new laser is sensitive to changes in height, even on an incredibly smooth surface. As displayed in the histogram, not all the data was assigned to the first bin. Some was sorted into the second, meaning the sensor was generating very sensitive height readings on a very smooth surface. Secondly, the results met expectations. On a very flat surface, the changes in height between points were assumed to be extremely small, and the sorting reflected that assumption by assigning data to bins one and two.
Repeating the process used to establish a smooth surface baseline, the next item scanned was a sawtooth metal object. The sawtooth depths were 4.5mm, and the distance between the peaks was 9mm. The texture of the flat surfaces was not highly polished, so the metal had a near-smooth sanded texture. As seen below in Figure 14 and Figure 15, this object’s texture profile has a constant change in height, and the height changes are significant. Most of the data was sorted into bin 14 in the Texture Signature histogram, meaning the height changes are in the 4-5mm range. The histogram bins are displaying the percentage of the data that falls into each height change bin. Conclusively for this object, roughly 97.1% of the texture data falls into that 4-5mm bin, aligning with expectations for this object’s manufactured texture.
A machine-fabricated square tooth metal object was the next item to scan and analyze. The square tooth depth was cut to roughly 3mm, and the peaks and valleys were about 5mm wide. Similar to the sawtooth sample, the surface texture was slightly sanded, and not polished smooth. The texture signature for this example exhibited a lot of flatness. The peaks were flat. The valleys were flat. However, at the height change point from a peak to a valley on the corner of each square tooth, some of the data was sorted into bins 12 and 13 (2-3mm and 3-4mm height change categories). Otherwise, approximately 79.11% of the data was in the first 2 bins due to the flat surfaces of the square tooth object.
The fourth controlled texture analysis was performed on a computer wire ribbon. The diameter of each of the insulated wires is about 1mm, though not perfectly so. The entire ribbon object had a slight undulation to it, not laying perfectly flat on a surface, and the plastic insulation itself was very smooth. The texture signature for this sample was more diverse. Since the wires were round, the change in height is more variable. As expected, all the height change data was sub-millimeter since the ribbon wire was only about 1mm thick. It had areas of flatness because of the small spaces between the wires, but most of the data was distributed between the 2nd and 5th bins.
Completing the evaluation of the four manufactured objects, the functionality of the Texture Signature and the interpretation of the histogram bins became more obviously telling. Understanding that the texture signature bins were capable of providing valuable and recognizable information, the next step in the research was to scan real pavement core examples. By collaborating with the Ohio Department of Transportation, a large collection of core samples extracted for a texture research project were made available, each with known MPD and skid number values. A selection additionally included MTD values. The core sample database consisted of 60, 6-inch core samples representing a range of pavement types, ages, and treatment applications. All cores were evaluated for skid number using the locked wheel skid testing. Most were scanned in-lab using the Ames 9400HD Texture Scanner (Ames Engineering, n.d.), which outputs MPD and ETD values for each. Many core samples were additionally tested using the sand patch testing method (ASTM International, 2019), producing MTD values.
With these scans, ODOT preserved a snapshot of texture data representing different pavement types, treatments, and states of wearing. The Ames Scanner software outputs MPD (Ames Engineering, n.d.). So, the ODOT database contained Skid Number and MPD values for nearly all of the cores.
An initial step was to verify that MPD calculated from the Texture Signature data correlated well with MPD from the Ames 9400HD Texture Scanner on the core samples. The Ames scanner is a stationary unit for in-lab testing (Ames Engineering, n.d.) and has a higher resolution than the Texture Signature System meant for network-level collection at posted speeds. Researchers wanted to observe if the difference in resolution significantly impacted MPD values. If the Texture Signature’s MPD values correlated well, that offered confidence that the hardware configurations would provide similarly high-quality data.
The cores were placed on a tangent stand under the Texture Signature laser to simulate vehicle travel and to gather enough sample data for comparison to the Ames core scans. The samples completed a rotation under the laser in roughly 20 seconds. During that span, roughly 60,000, 500-point samples at 0.2mm resolution were collected per core. The Texture Signature System displays MPD in real time during the core rotation. Once the texture scans were complete, MPD values were recorded for comparison. As seen in Figure 22 below, the readings from the Texture Signature System and the Ames 9400HD Scanner correlated extremely well from sample to sample, resulting in a 99.4% correlation coefficient.
The results established a very high level of confidence in the data. At this point in the research, it was time to analyze all available data sets together: the MTD data from sand patch testing, the MPD data from the Ames core scans, and the MPD data from the Texture Signature System to evaluate those values against the Skid Numbers of the ODOT cores.
As seen in Figure 23, the MPD data showed a 41% correlation to the Smooth Tire Skid Number and a 27% correlation to the Ribbed Tire Skid number. Somewhat as anticipated, these are low and negligible comparisons, matching the industry’s sentiment that MPD does not appropriately identify many of the elements of pavement texture that affect Skid Number and are inherently incorporated into force analyses within tire-to-pavement friction testing.
Interestingly, however, a section of the comparison graph drew attention during the analysis. Highlighted in the red box of Figure 23 is a section of 3 cores where the MPD trendline was flat, meaning there was a similar MPD value from core to core. for those same core samples, there was a significant jump in Skid Number. (Specifically looking at cores 25, 26, and 27.)
Here in Figure 24, you can see core 25 was a coarse Limestone aggregate that, according to ODOT notes, had experienced very little traffic. It had an MPD value of 0.647.
Core 26 is a sample that had a Jennite sealant on it. It was slightly worn and was beginning to crack, but it was still in a suitable condition. Its MPD value was 0.546.
The third core, core 27, was also a Jennite sealant sample, but it had degraded a bit more than core 26. More cracking was observed, and it was peeling away from the surface. It had an MPD value of 0.658.
At this point for the study, the three cores were analyzed using the Texture Signature binning system. Hypothetically, if the texture signatures looked different (as the Skid Numbers did), that would suggest that the Texture Signature data could detect a difference in surface texture where the MPD calculation was insufficient. The hypothesis was that core 25 would have a significantly different Texture Signature than cores 26 and 27, and cores 26 and 27 would have similar Texture Signatures.
This hypothesis was realized in the comparison work. As seen in Figure 27, cores 26 and 27 with the Jennite sealant are very flat, and accordingly, the percentage of data that fell into the smallest change in height bin was very high. There is very little data that changes in height greater than 0.5mm from point to point. This illustrates that the changes in height between points are very gradual and representative of a smooth surface.
Core 25 presents different results. Looking at the Texture Signature, the data from core 25 is much more evenly distributed across the bins. It even has a percentage of data in the 11 bin, which is for changes is in height from 1-2mm. This indicates that it had an overall level of flatness because of the amount of data represented in the first 5 bins, but there was some coarseness to the surface texture that has depth as well.
To reiterate, the goal of this study was to explore a new method to collect network-level texture data that would be a better predictor of resistance to skid or Skid Number than MPD. Continuing with the research, there was still a need to correlate Texture Signature data to the Skid Number data from the OH cores. The Texture Signature suggested a revolutionary way to interpret the data, differently than the capabilities of MPD. Still to be realized was the correlation directly to Skid Number. So, in order to create a single Texture Signature value for comparison, the percentages in the bins were weighted, thus creating the “Texture Signature Number”.
Creating the Texture Signature Number accomplished three important concepts:
To give an example, Core 30 has a very high Skid Number, the highest Skid Number of all the core samples. Reviewing the Texture Signature, the majority of its data fell into bins 11-14. Bins 11-14 represent changes in height from 1-5mm. Those measures are dramatic height changes, so the interpretation of the histogram is that the core sample has a very coarse texture.
In the opposite case, cores 26 and 27 had some of the lowest Skid Numbers, and the majority of that data fell into the first couple of bins in the Texture Signature.
Ultimately, this information suggested that a new formula should use a positive and negative weighting system for the creation of the Texture Signature Number: promoting the values in bins 11-14 using positive weighting, because those would have a positive effect on Skid Number, and demoting bins 1 and 2, which represent smoothness, and would have a negative effect on Skid Number. Applying the appropriate weighting system resulted in a dramatic improvement in correlation between Skid Number to the newly calculated Texture Signature Number.
When comparing to Ribbed Tire Skid Number for all core samples, the MPD from the Texture Signature System compared at 27%. The Texture Signature Number using the new formula correlated at 71%, a significant increase in correlation using the same data set from the new laser. When comparing to Smooth Tire Skid Number, MPD from the Texture Signature System compared at 41% while the Texture Signature Number correlated at 82%, an even greater increase in correlation from yet the same data set. The difference between these correlations was exclusively the method of calculation, comparing the standard MPD value versus Skid Number versus comparing the Texture Signature Number versus Skid Number.
To summarize the initial findings from this new pavement Texture Signature research:
For more than 20 years, pavement engineers have been leveraging Mean Profile Depth (MPD) data collection in tandem with locked wheel skid resistance testing to manage their treatment and maintenance decisions. This was the best data the industry could provide. Technological advancements have opened a door to new laser sensor capabilities and expanded the amount of data available and scan frequency possible during roadway pavement data collection. While MPD has played a supporting role in understanding pavement surface texture, now is the time to take advantage of technology to revolutionize the interpretation of pavement surface texture as it correlates to tire-to-pavement friction, updating the metric pavement managers use to support their texture and friction-related decisions.
As in all cases, this research is by no means exhausted nor concluded. There is much yet to be investigated and evaluated to further explore how the Texture Signature can improve network data collection and pavement condition assessments.
ACKNOWLEDGMENTS
The authors would like to thank Brian Schleppi, and the Ohio Department of Transportation for their contributions as subject experts and sample contributions.
AUTHOR CONTRIBUTIONS
The authors confirm contribution to the paper as follows: All work, concepts, diagrams, figures, and tables are our own.
Ames Engineering. (n.d.). Ames Engineering. Retrieved July 28, 2022, from https://amesengineering.com/products/laser-texture-scanner-model-9400/
ASTM International. (2016). Standard Practice for Calculating Macrotexture Mean Profile Depth.
ASTM International. (2019). Standard Test Method for Measuring Pavement Macrotexture Depth Using a Volumetric Technique.
International Standards Committee. (2009). ISO. Retrieved July 28, 2022, from Online Browsing Platform: https://www.iso.org/obp/ui/#iso:std:iso:13473:-5:ed-1:v1:en
Robert Rasmussen, C. H. (2017, April 27). Transportation Research Board. (Transportation Research Board) Retrieved July 28, 2022, from Online Pubs: https://onlinepubs.trb.org/onlinepubs/webinars/170427.pdf
PRESENTATION DOWNLOAD LINK: "PAVEMENT TEXTURE SIGNATURE: A Statistical Analysis of Pavement Texture"
PathRunner Subsystem Upgrades
NEW 3D System: 3D-PAS
NEW HD LiDAR System
NEW 3-Zone Texture Signature System
PathView II
Login to your account to download your latest version of PathView II from the software folder under “Resources”.
PathView
Version 6.2.10 (Released November 23, 2022)
PathWeb
Version 2.28.0 (Released July 25, 2022)
PathPoints
Version 2.67.7 (Released November 21, 2022)